

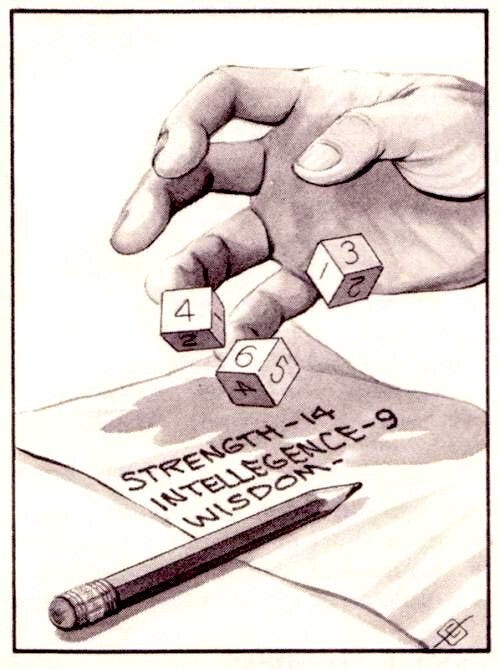
Roll Them Digital Bones
Multiple Ways to Get the Results of 3d6 Using a Computer

I recently saw a post by one of my favorite game designers Richard Iorio over at his Rogue Games Substack. Richard has worked on a number of excellent role playing games ranging from Colonial Gothic (a Revolutionary Horror game) to Shadow, Sword, and Spell (a Sword & Sorcery Game) with quite a bit of freelance work in between. You can read more about his work at his company’s website.
He was writing about the logic behind his proprietary 12° game system and why the baseline difficulty in the system is 50%. There are a number of arguments that can be made in favor of using 50% as your starting point and moving from there as things get more challenging and Richard does a good job of articulating some good ones.

One of the things he does in the article is run simulations to demonstrate how his 12° game mechanics fit well with these assumptions. I enjoyed reading his simulations, in part because I often code mechanical simulations when I’m initially evaluating what I think about a game system. I am a firm believer that game play is the only way to truly evaluate a game in full, but simulations help to set expectations and reveal the quirks of the system.
The thing is that you can use several methods to run simulations, depending on whether you want to do a procedural simulation or a mechanical simulation. A while back I was perusing social media and saw a discussion that asked people what their to state their preferred method of generating player characters for “Old School” role playing games like D&D Basic. I personally like rolling 4 six-sided dice and taking the best 3 for each stat, but there are many who prefer a more stringent approach.
The traditional way, especially in Basic D&D, is to roll 3-six-sided dice (3d6) in order and you get what you get and have no regrets. The gaming audience has expanded since those days. There are many more narrative focused gamers than their used to be and we seem to have hit the ceiling of the number of wargaming/tactical focused gamers who participate in the role playing hobby. With most of the groups I’ve played with in the past decade or so, I’ve found that many players are resistant to creating characters the traditional way. They aren’t used to having their characters be as “average” as most characters produced using 3d6 tend to be. They want to be heroic and 3d6 doesn’t generate a lot of heroic characters.

To be fair to the modern narrative oriented game, statistics matter a lot more to the core math underlying more modern versions of D&D and it takes a lot longer to make a character in 5th edition than it did in Basic D&D. Because low level characters in Basic D&D had so few options compared to modern characters, the time to make them was considerably less.
As much as I would like to continue down the path of discussing various editions of D&D and various ways of playing the game, those conversations will have to wait for another time. I really want to focus this article on the different ways you can emulate the rolls used to create a character using the R programming language (or other coding techniques if you wish).
The way I see it is that there are two ways of looking at how to implement the rolling of statistics when using computers as randomizers, you can simulate the action of rolling or you can jump straight to simulating the outcomes.
Simulate the Rolling
As I mentioned first is to directly model the action of rolling the dice. In the case of rolling 3d6, you would create code where you set the value of a die, roll it three times and add those results together. This has the advantages of being completely intuitive and having the computer code be intelligible to almost anyone who looks at them.
Here’s an example:
## Set Up Dice
d6 <- seq(1,6)

## Roll Stats
STR <- sample(d6, 1) + sample(d6, 1) +sample(d6, 1)
INT <- sample(d6, 1) + sample(d6, 1) +sample(d6, 1)
WIS <- sample(d6, 1) + sample(d6, 1) +sample(d6, 1)
DEX <- sample(d6, 1) + sample(d6, 1) +sample(d6, 1)
CON <- sample(d6, 1) + sample(d6, 1) +sample(d6, 1)
CHR <- sample(d6, 1) + sample(d6, 1) +sample(d6, 1)

## Roll Starting Gold
gold <- (sample(d6, 1) + sample(d6, 1) +sample(d6, 1)) * 10
Even if you aren’t proficient with any programming languages, you can probably follow the steps above to see that I’ve modeled the d6 as a sequence of numbers running from 1 to 6 and that the stats are determined by rolling a d6 three times and adding them together. You might be wondering what that “comma 1” is doing after the d6, but that’s just telling it to only roll the sequence once. When I initially ran the program it defaulted to rolling 6 times and saving those and adding those to future rolls in a way that produced all 6 stats at once. I didn’t think that was as intuitive, so I forced it to do it one at a time.
I could have coded the stats this way:
str <- sum(sample(d6, 3))
In this case it’s saying to roll a d6 three times and add them together or “sum” them. I don’t that looks as intuitive as the earlier code either. This particular method produces integers, rather than numbers (you can read about what that means elsewhere), but if you wanted numbers instead of integers (and I don’t know why you would) you could do it this way:
str <- as.numeric(sum(sample(d6, 3)))
Once again, I don’t think this makes as much sense to the average person, but it does provide a nice step along the path of emulating “outcomes” rather than “action.”
Simulating Outcomes
Simulating outcomes is a completely different approach to generating random numbers for characters. In this case, we aren’t worried about making sure that our code looks like the action being simulated. Instead, our only concern is that the output be equivalent to doing the action in the first place. In this case, we would base the results on the statistical distribution and we would generate the final result for a single statistic with code that looks something like this:
roll <- round(rbnorm(1, mean = 10.5, sd = 2.958, lowerbound = 3, upperbound =18))
This is far less intuitive for the average person and requires the person generating the information to understand the statistical distribution of rolling 3d6 and adding them together. We need the following information in order to emulate the statistical distribution: the mean, the standard deviation, the minimum value possible, and the maximum value possible. In order to find the mean, we need to know the frequency with which every number occurs so that we can add all those values together and then divide those by the total number of possible combinations. Delta’s website has a nice presentation of the frequency each value shows up on a roll of 3d6.
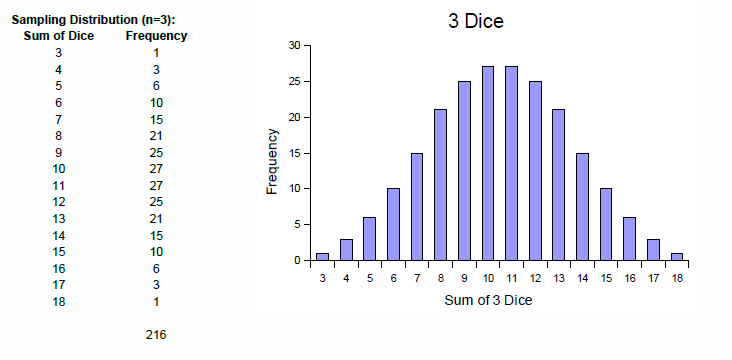
Just by looking at the picture, we can see that the sampling distribution of rolling 3d6 looks similar to a normal distribution. We’ve got a really nice bell curve here, one that Gary Gygax discussed in the first edition of the AD&D Dungeon Masters Guide on page 10.

Knowing that it is similar to a normal distribution helps us emulate the die rolls as we can use the rnorm (normal distribution) or rbnorm (bounded normal distribution) functions in R to generate results. Before we get that far though, we need to calculate the mean of the results. We do this by multiplying the value (from 3 to 18) by the number of times that value occurs and adding all those together and then dividing that result by the total number of rolls possible (216 aka 6 times 6 times 6).
I’ve done that process on this spreadsheet and found that the Mean is 10.5. Once we’ve found the mean, we need to find the standard deviation. As Elena Llaudet demonstrates in her excellent book Data Science for the Social Sciences, and on her website, the standard deviation will let us know how “tall” or “flat” the curve is. Though rolling 3d6 is similar to the normal distribution an individual d6 provides a discrete uniform distribution (every number has an equal chance of occurring), so that means that there are two ways for us to calculate the standard deviation. We can use the short, but not intuitive, standard deviation formula we get from the discrete uniform distribution or we can go step by step.
Short Non-Intuitive Way
The short and non-intuitive way was demonstrated in an RPG.net forum by user torbenm. His method requires you to know that standard deviation is the square root of the variance and how to calculate the variance in a discrete uniform distribution, which is done by squaring the number of possible outcomes, subtracting one, and then dividing by 12. In the case of a six-sided die, this would be 6-squared (36), minus 1, divided by 12. We know this because we either trust torbenm, we trust our statistics book, or we read it on Wikipedia.

Typical in this kind of presentation, torbenm did not provide us with the underlying reasoning for why this is how you determine the variance. Instead, this is what he wrote.
For XdY, the standard deviation is sqrt(X*(Y^2-1)/12). For example, the standard deviation of 3d6 is sqrt(3*35/12) = 2.958. This is a relatively simple formula. I know of no closed formula for the mean deviation of XdY except for a few special cases: The mean deviation of 1dY is (floor(Y^2/4))/Y and the mean deviation of 2dY is (Y^3-Y)/(3Y^2).
“This is a relatively simple formula.” That’s true, but it’s also one that he doesn’t show the why of. So can we trust him? Short answer, yes. Long answer, no way we need to get to the next step of this blog and get to the long explanatory way of getting the standard deviation.
The Long Explanatory Way
As I mentioned earlier, in order to simulate the rolling of 3d6, we need to know the mean, the standard deviation, and the range (3 to 18) of the numbers that we are trying to get. We know how to calculate the mean, as we’ve already discussed it, but how do we calculate the standard deviation? Thankfully Khan Academy has a very useful tutorial, as they do for pretty much any mathematical concept.
The first thing Khan Academy does is to show us the equation for calculating the standard deviation:

See? That’s perfectly clear. Right? Right?
Actually, yes I’m going to explain it. Let’s ignore the square root for the minute and do as the Khan Academy article does and focus on what’s inside the square root symbol. That’s the variance of the distribution and the great thing about this version of the variance is that it isn’t a “trust me” version. It is a step by step version that can be used on any set of data.
Let’s start with the numerator (the top) equation in the fraction.

The first thing you might notice is the μ symbol after the negative sign. This is mu. It means, well, mean. We’ve already calculated the mean, above, and know that is 10.5. That leaves that big ∑, or sigma, which means “sum of.” It just means “add up everything attached to me. In this case, we want to add up all of the deviations to get the “sum of squares”:

Or stated in non-equation form, the squared distance from the mean of every possible result of the dice. So we take the 3 for example, we subtract 10.5 from 3 and get -7.5 as the deviation (distance from mean) and square that to get rid of the negative value. You can see on the spreadsheet, where I’ve done this for every individual roll, that this is 56.25. This is the squared deviation of that individual value. We need to do this for every single possible individual roll, so yes for each time the dice would result in 10 for example, and add all those squared deviations up to get a final result of 1890 (this is the sum of squared deviations or the “sum of squares”).
Now we apply that denominator (that’s the bottom of the fraction) and divide by the total number of possible rolls (216).

Before we move on though, I wanted to show you that we really can trust torbenm. You see, the result we just came up with 1890/216 can be simplified to give us 105/12, which I show on the spreadsheet linked above. Hmmm…that 12 looks familiar. Keeping in mind we are rolling 3 dice and not one and that torbenm’s “simple equation” had that little 3* (three times) there for a reason, that reason being that three dice were being rolled. If we divide 105/12 by three, and remember that when dividing fractions we only divide the numerator and the denominator stays the same when dealing with whole numbers, we get 105/3 = 35 and put that back over 12 and voila 35/12.
Remember that when dividing a fraction by an integer you are dividing both the top and bottom of both “fractions” and that the fraction for 3 is 3/1. 105/3 is 35 and 12/1 is one. And we end up back at his simple fraction, but we do so in a way that let’s us work with any set of data and not just data with an underlying discrete uniform distribution. Yes, all platonic dice have discrete uniform distributions so we can use his simple equation on any of them, but it’s fun to go through the full process to see your result.

Finally, we take the square root of the variance and get the same 2.958 that was arrived at earlier, but we do so knowing more about the process and in a way that lets us use R programming language’s rnorm and rbnorm functions in order to roll the dice with code that looks like.
# An initial roll (Let's do 216 rolls to see a distribution)

STR <- round(rnorm(216, mean = 10.5, sd = 2.958))

# Or if we want it bounded between 3 and 18

STR <- round(rbnorm(1, mean = 10.5, sd = 2.958, lowerbound = 3, upperbound =18))
The first bit of code generates all possible numbers within a normal distribution with a mean of 10.5 and a standard deviation of 2.958. We’ve used the round function in order to get only whole numbers. This gives us a distribution that looks like:

That looks like the standard distribution for rolling 3d6. This works fine for any number of rolls from 1 to about 1,000 or so, but then things can get a little weird. Because we didn’t limit the distribution to only numbers between 3 and 18, it is possible to get numbers beyond that scale and get results lower than 3 and higher than 18.

They aren’t common, but they are possible. That’s why we use the bounded distribution. That’s the second bit of code. When we roll that one 216 times, we get the following.

And at 100,000 we get:

That’s better.
Okay, now that I’ve gone through all that ridiculous work and writing and have probably lost you, which method would you use to emulate rolling 3d6 in a computer program?
Me? I’m emulating the rolling of individual dice, but I liked working through the whole deal.
You weren’t kidding about coding! Wow!
Well, you went into more detail than I did. :)
Seriously, I only wonder what if you went with a straight point buy like the RPGA did back in the D&D 2E days?